In this yearly analysis, we provide an in-depth review of the European MedTech, Diagnostics, and Digital Health investment landscape in 2024 by examining quarterly performance, yearly trends and comparisons, and key sector highlights. The document is structured into quarterly overviews and annual comparisons of total capital invested, median deal sizes, and sectoral trends.
Q4 2024: Stable deal volume with a significant reduction in total capital deployed compared to Q4 2023
The fourth quarter of 2024 demonstrated interesting investment dynamics in the European MedTech, Diagnostics, and Digital Health landscape. In this period, the market saw a total of 69 deals (44 of which had disclosed values), totalling $658,4M in capital invested.
Venture financing accounted for the majority of investment activity with 43 deals. These deals showed a distinct pattern across different stages of company development. The seed stage recorded 5 disclosed deals, suggesting continued interest in early-stage innovation despite market uncertainties. The start-up stage saw increased activity with 11 disclosed deals, while growth and later-stage investments dominated with 23 transactions (19 of which disclosed).
The quarter also witnessed 14 M&A transactions totalling $175M. Private equity activity remained selective with 3 undisclosed deals, while equity offerings saw 5 transactions amounting to $86,3M.
The IPO window remained effectively closed, as private financing and M&A dominated as funding routes for MedTech companies.
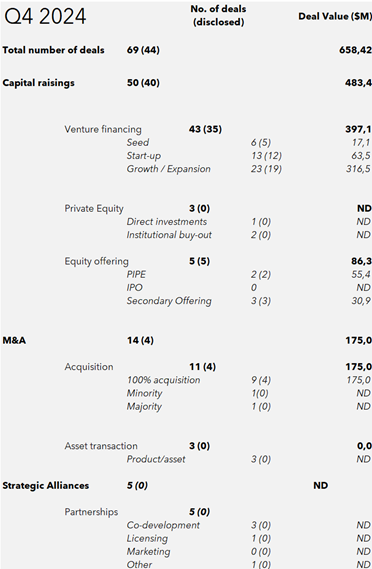
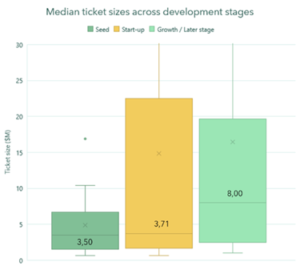
Looking specifically at disclosed venture deals, median tickets were within the same order of magnitude – particularly between seed and start-up financing (at $3,5M and $3,71M respectively), followed by tickets around $8M for later stage companies (Figure 1).
Highlights
Two transactions particularly exemplify the quarter’s investment themes:
- Cardiology Analytics Series B (November 2024): A $28,5M Series B round for this AI-powered cardiac monitoring platform demonstrates the continued appetite for digital health solutions with proven clinical impact. The round, led by healthcare-focused venture firms and strategic investors, highlights how companies that combine technological innovation with clear clinical validation can still attract capital, even in a more selective market.
- NeuroDrive’s Strategic Exit (December 2024): The acquisition of NeuroDrive by a major medical device manufacturer for $45M represents the evolving dynamics of strategic M&A. The deal’s structure included significant milestone payments tied to regulatory approvals, reflecting a broader trend toward risk-sharing in acquisitions. The transaction particularly highlights how buyers are increasingly focusing on near-term value creation rather than solely long-term potential.
Q4 2024 matched Q4 2023 in deal volume with 69 deals but saw a significant decline in total capital deployed, dropping from $2.371M to $658.4M
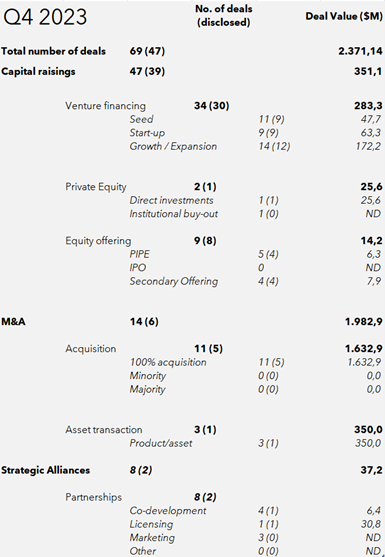
Comparing Q4 2024 with the same period in 2023, we see shows several significant shifts in investment patterns. Both quarters recorded a total of 69 deals otal deals, showing consistency in overall market activity. However, the composition and characteristics of these deals reveal how the market evolved over the year.
Looking at deal disclosure rates, we see a shift toward privacy: Q4 2024 had 44 disclosed deals compared to 47 in Q4 2023.
The most striking difference appears in total capital deployment. While Q4 2023 saw $2.371M invested across its 69 deals, Q4 2024 recorded $658,4M – a 72% decrease.
Venture Financing showed a slight comparative increase as deal count increased from 34 to 50 deals. Disclosed amount of capital shows a small increase compared to the same quarter last year ($351M in Q4 2023 vs. $483M in Q4 2024).
M&A activity has also been comparatively stable in terms of number of transactions at 14 each quarter, whereas the total amount of disclosed capital significantly dropped from $1.982M to $175M end 2024.
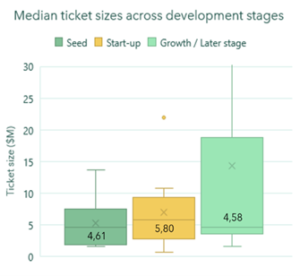
Reflecting on differences in median deal sizes, we observe a decrease since Q4 2024, where the seed tickets in Q4 2023: $4,61M (9 disclosed deals) Q4 2024: $3,50M (5 disclosed deals).
Tickets across start-up stages have seen a similar decrease, with 9 disclosed deals ($5,80M) in Q4 2023 vs. 12 disclosed deals ($3,71M) Q4 2024, although the range of tickets deployed into start-ups was wider in 2024.
Later stage financing focused on growth and commercialization of innovations showed a 74% decrease in median deal sizes, suggesting a reset in growth-stage valuations since the same quarter. Q4 2023 saw 12 disclosed deals ($4,58M) while Q4 2024 totaled $8,00M (19 disclosed deals).
2024 maintained consistent deal volume with reduced total capital investment and smaller median deal sizes across all stages
Overall, the European MedTech, Diagnostics, and Digital Health landscape in 2024 demonstrated a dynamic evolution in investment patterns across quarters – showing both resilience in deal volume and strategic adjustments in capital deployment.
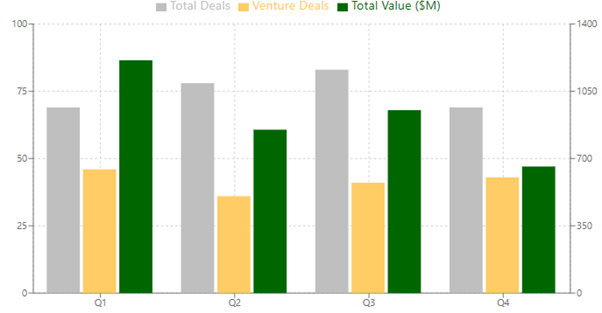
2024 began strong in with a total investment in Q1 of $1.211,2M across 69 deals (49 disclosed), driven by robust venture financing activity ($705,5M, 46 deals). This initial momentum moderated in Q2, with total investment decreasing to $849,8M despite increased deal activity (78 deals, 57 disclosed). Q3 showed signs of recovery with $951,7M invested across 83 deals (51 disclosed), before a more measured Q4 closed the year with $658.4M across 69 deals (44 disclosed).
Throughout 2024, the IPO window for MedTech, Diagnostics, and Digital Health companies remained largely inactive, reflecting a shift toward private funding sources, strategic alliances, and M&A activity as preferred routes for capital acquisition.
The progression of median deal sizes across investment stages throughout 2024 reveals interesting patterns, as Figure 4 shows.
Table 3: Quarterly overview of capital invested across quarters in 2024.
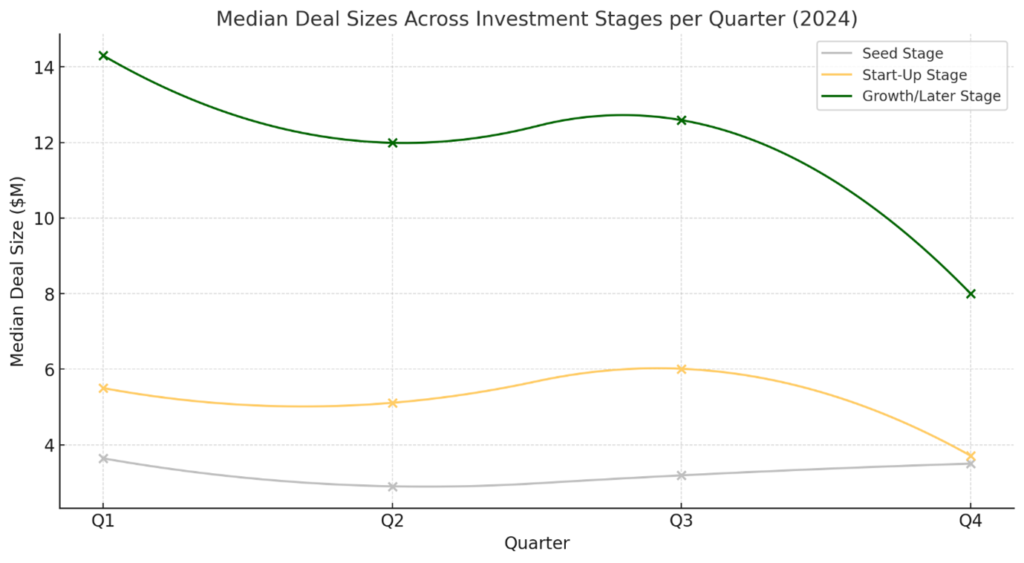
Seed stage median tickets showed stability with an end-of-year recovery, whereas start-up tickets showed resilience through Q3 before a significant adjustment in Q4 at $3.71M. Growth/later stage $8.00M exhibited a gradual downward trend throughout the year, starting with larger tickets at ~$15M but ending at a median of $8M.
Market Distribution Analysis
The 2024 landscape showed significant diversity in investment focus, with Digital Health maintaining clear leadership while other sectors demonstrating varying levels of activity, as Figure 5 shows.
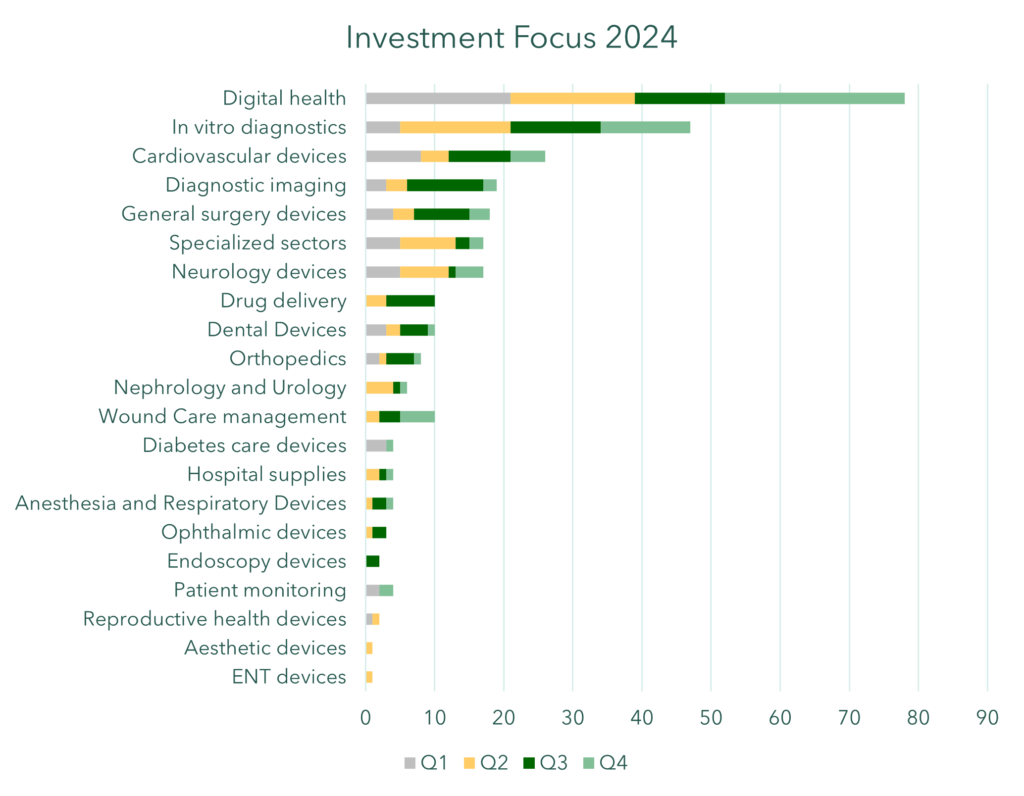
The top 5 markets by deal volume showcased strong activity across key sectors. Digital Health led with 78 total deals, experiencing consistent performance in Q1-Q3 (19-21 deals per quarter) and a moderate rise to 26 deals in Q4. In-vitro Diagnostics followed with 47 deals, maintaining steady quarterly activity (5-16 deals per quarter). Cardiovascular Devices secured 26 deals, reflecting reliable performance (8-9 deals per quarter). Diagnostic Imaging recorded 19 deals, though a notable dip (2 deals vs. 8-11 in previous quarters) was observed in Q4.
Drug Delivery, with 10 deals, demonstrated stable quarterly activity (3-7 deals per quarter). Among Emerging Sectors, Neurology Devices showed strong momentum with 17 deals and Dental Devices remained steady with 10 deals, while Ophthalmology Devices peaked in Q2/Q3 with 3 deals. Additionally, Patient Monitoring exhibited consistent but limited activity (1 deal per quarter), while Urology, Dermatology, and Emergency Medicine saw sporadic deals – primarily in the middle quarters.
Stable deal volume, declining capital, and a shift towards growth-stage focus define 2022–2024
The European MedTech, Diagnostics, and Digital Health sectors underwent significant transformations over the past three years, with 2024 reflecting both resilience and recalibration in the face of ongoing macroeconomic pressures.
Table 4: Yearly comparison overview 2024 vs. 2023 and 2022
2022: Investment activity peaked, with a surge in capital deployment across all investment stages. Investor sentiment was high, marked by high tickets across seed, start-up, and growth/later stages.
2023: Invested capital gradually decreased despite deal numbers remaining stable. Smaller median ticket sizes were found across early-stage deals.
2024: In this year of recalibration, overall (disclosed) capital investment shrank sharply while deal flow remained consistent. Investors demonstrated increased selectivity, favouring growth-stage companies.
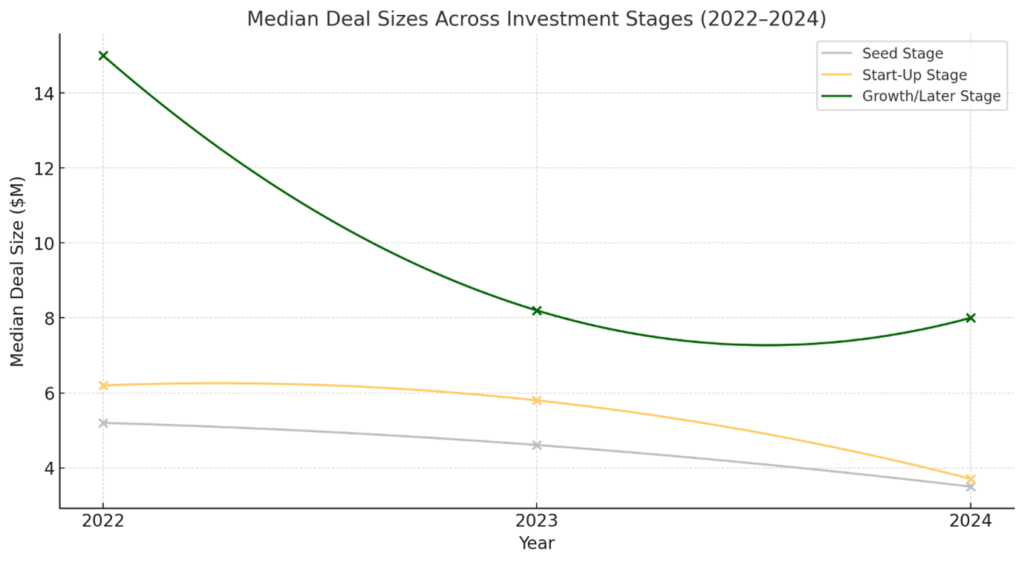
Over the past three years, the European MedTech sector witnessed a decrease in capital injection despite stable deal volumes – reflecting a shift towards cautious and value-focused investing.
2024 showed consistent deal activity, reduced capital investment, and stabilized growth-stage financing. While challenges remain, the foundation laid in 2024 provides stability for growth and innovation, suggesting a measured yet steady outlook for 2025.
What does the Venture Finance team at FFUND do?
FFUND’s Venture Finance team helps building and strengthening companies’ propositions to raise capital in an investment round. We do this by offering a number of services: analyzing the companies’ performance through assessment of key indicators, designing the data-room, performing market analyses, company valuations and composing the business plan and teaser deck for investors. On top of that, the team leverages its network of investors to receive feedback on your proposition while serving as a warm introduction.

